

Bitcoin investors are buying protection around $50,000 even as the flagship digital asset holds near $70,000 and has recently outperformed gold, the S&P 500, and the US dollar during the ongoing Iran war.
According to CryptoSlate’s data, Bitcoin was trading at about $70,688 at press time, which means hedging around the $50,000 level means investors are guarding against a roughly $20,000 drawdown, even as the spot price remains firm.
The contrast has become one of the clearest signals in the market. Spot Bitcoin has shown resilience through the first phase of the conflict, but the derivatives market still shows traders paying for downside insurance.
On Deribit, the latest public options-flow note showed buying in the $50,000 to $60,000 put zone, along with March put spreads and fresh downside structures after attacks on Middle East energy infrastructure and a hot US producer-price print.
That split suggests investors are no longer treating Bitcoin as a one-directional war trade. Instead, they are weighing two outcomes at once.
One is that Bitcoin continues to absorb geopolitical stress better than many expected. The other is that the oil shock spills into inflation, pushes rate-cut expectations further out, and drags risk assets lower, forcing BTC back toward the low-$50,000s.
Middle East crude is rising faster than Brent
Oil helps explain why that hedge has stayed in place. Reuters reported Brent settled at $108.65 a barrel on March 19 after reaching an intraday high of $119.13, while West Texas Intermediate touched $100.02 before ending at $96.14. Brent later traded at $107.29 after hitting $119 the previous day.
The Kobeissi Letter, a macro analysis platform, noted that the more severe move has been in the Middle East itself.
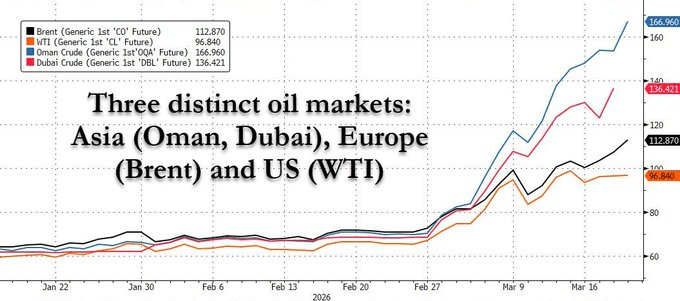 Oil Price Across the US, Europe, and the Middle East (Source: The Kobeissi Letter)
According to the firm, Dubai crude, a regional benchmark tied more closely to Gulf exports, hit $166.80 on March 19, while physical cargo prices for crude and fuel also set records as the conflict around Iran disrupted shipments through the Strait of Hormuz.
Oman’s oil price rose to $167 a barrel, while Brent remained near $113 and WTI traded around $97, leaving the gap between regional and global benchmarks at one of its widest levels in years.
That divergence has changed the market’s reading of the oil shock. Brent remains the headline benchmark, but the bigger stress is showing up in Gulf-linked cargoes, where traders are pricing the direct effect of disrupted shipping, lower exports, and supply fears around the Strait of Hormuz.
The Kobeissi Letter explained:
“When the war first began, US oil prices surged in the wake of uncertainty. However, as the Strait of Hormuz closed, markets began reassessing risks. While the Strait of Hormuz is closed, ~18% of global crude oil supply is offline.”
So, once that war premium moved from futures into physical barrels, the macro risk became harder for Bitcoin traders to ignore.
That would essentially shift the question for crypto investors from whether oil is rising to whether the rise remains contained in global benchmarks or continues feeding through Middle East cargo markets, keeping inflation pressure elevated for longer.
Why traders are still buying downside protection
That backdrop is showing up clearly in Bitcoin derivatives.
Deribit’s March 19 note described buying $50,000 to $60,000 puts and said downside protection was provided through April and December risk-reversal structures as the energy shock and inflation data hit the tape.
The current market structure of the flow also adds nuance, with some of the recent downside positions expressed through put spreads and risk reversals rather than outright crash bets.
This suggests a market that manages costs and defines risk rather than simply positioning for panic. Investors are still paying for defense, but they are doing so with targeted structures around a specific lower range.
Meanwhile, broader derivatives data point in the same direction. K33 Research said CME Bitcoin futures open interest had climbed back above 110,000 BTC, while perpetual open interest held between 260,000 and 270,000 BTC.
It also said the seven-day average funding rate was -2.2% and the 30-day average had been negative for 18 consecutive trading days, the longest streak since December 2022.
In practical terms, the futures and perpetuals markets are still leaning defensive, even as Bitcoin trades near the top of its recent range.
Deribit’s weekly report with Block Scholes showed the same caution in options. BTC at-the-money implied volatility was around 50%, seven-day implied volatility stood at 52%, and the futures-implied yield curve remained flat at 2% to 3% across tenors.
Put-call skew had recovered from the late-February low, but the surface had still not rotated toward calls. So, traders were no longer chasing downside hedges at the same pace as earlier in the month, yet they were still willing to pay for protection.
Glassnode’s positioning data reinforces that picture, showing that perpetual funding remained firmly negative, while directional premium remained bearish, and directional perp premium turned negative for the first time since 2022.
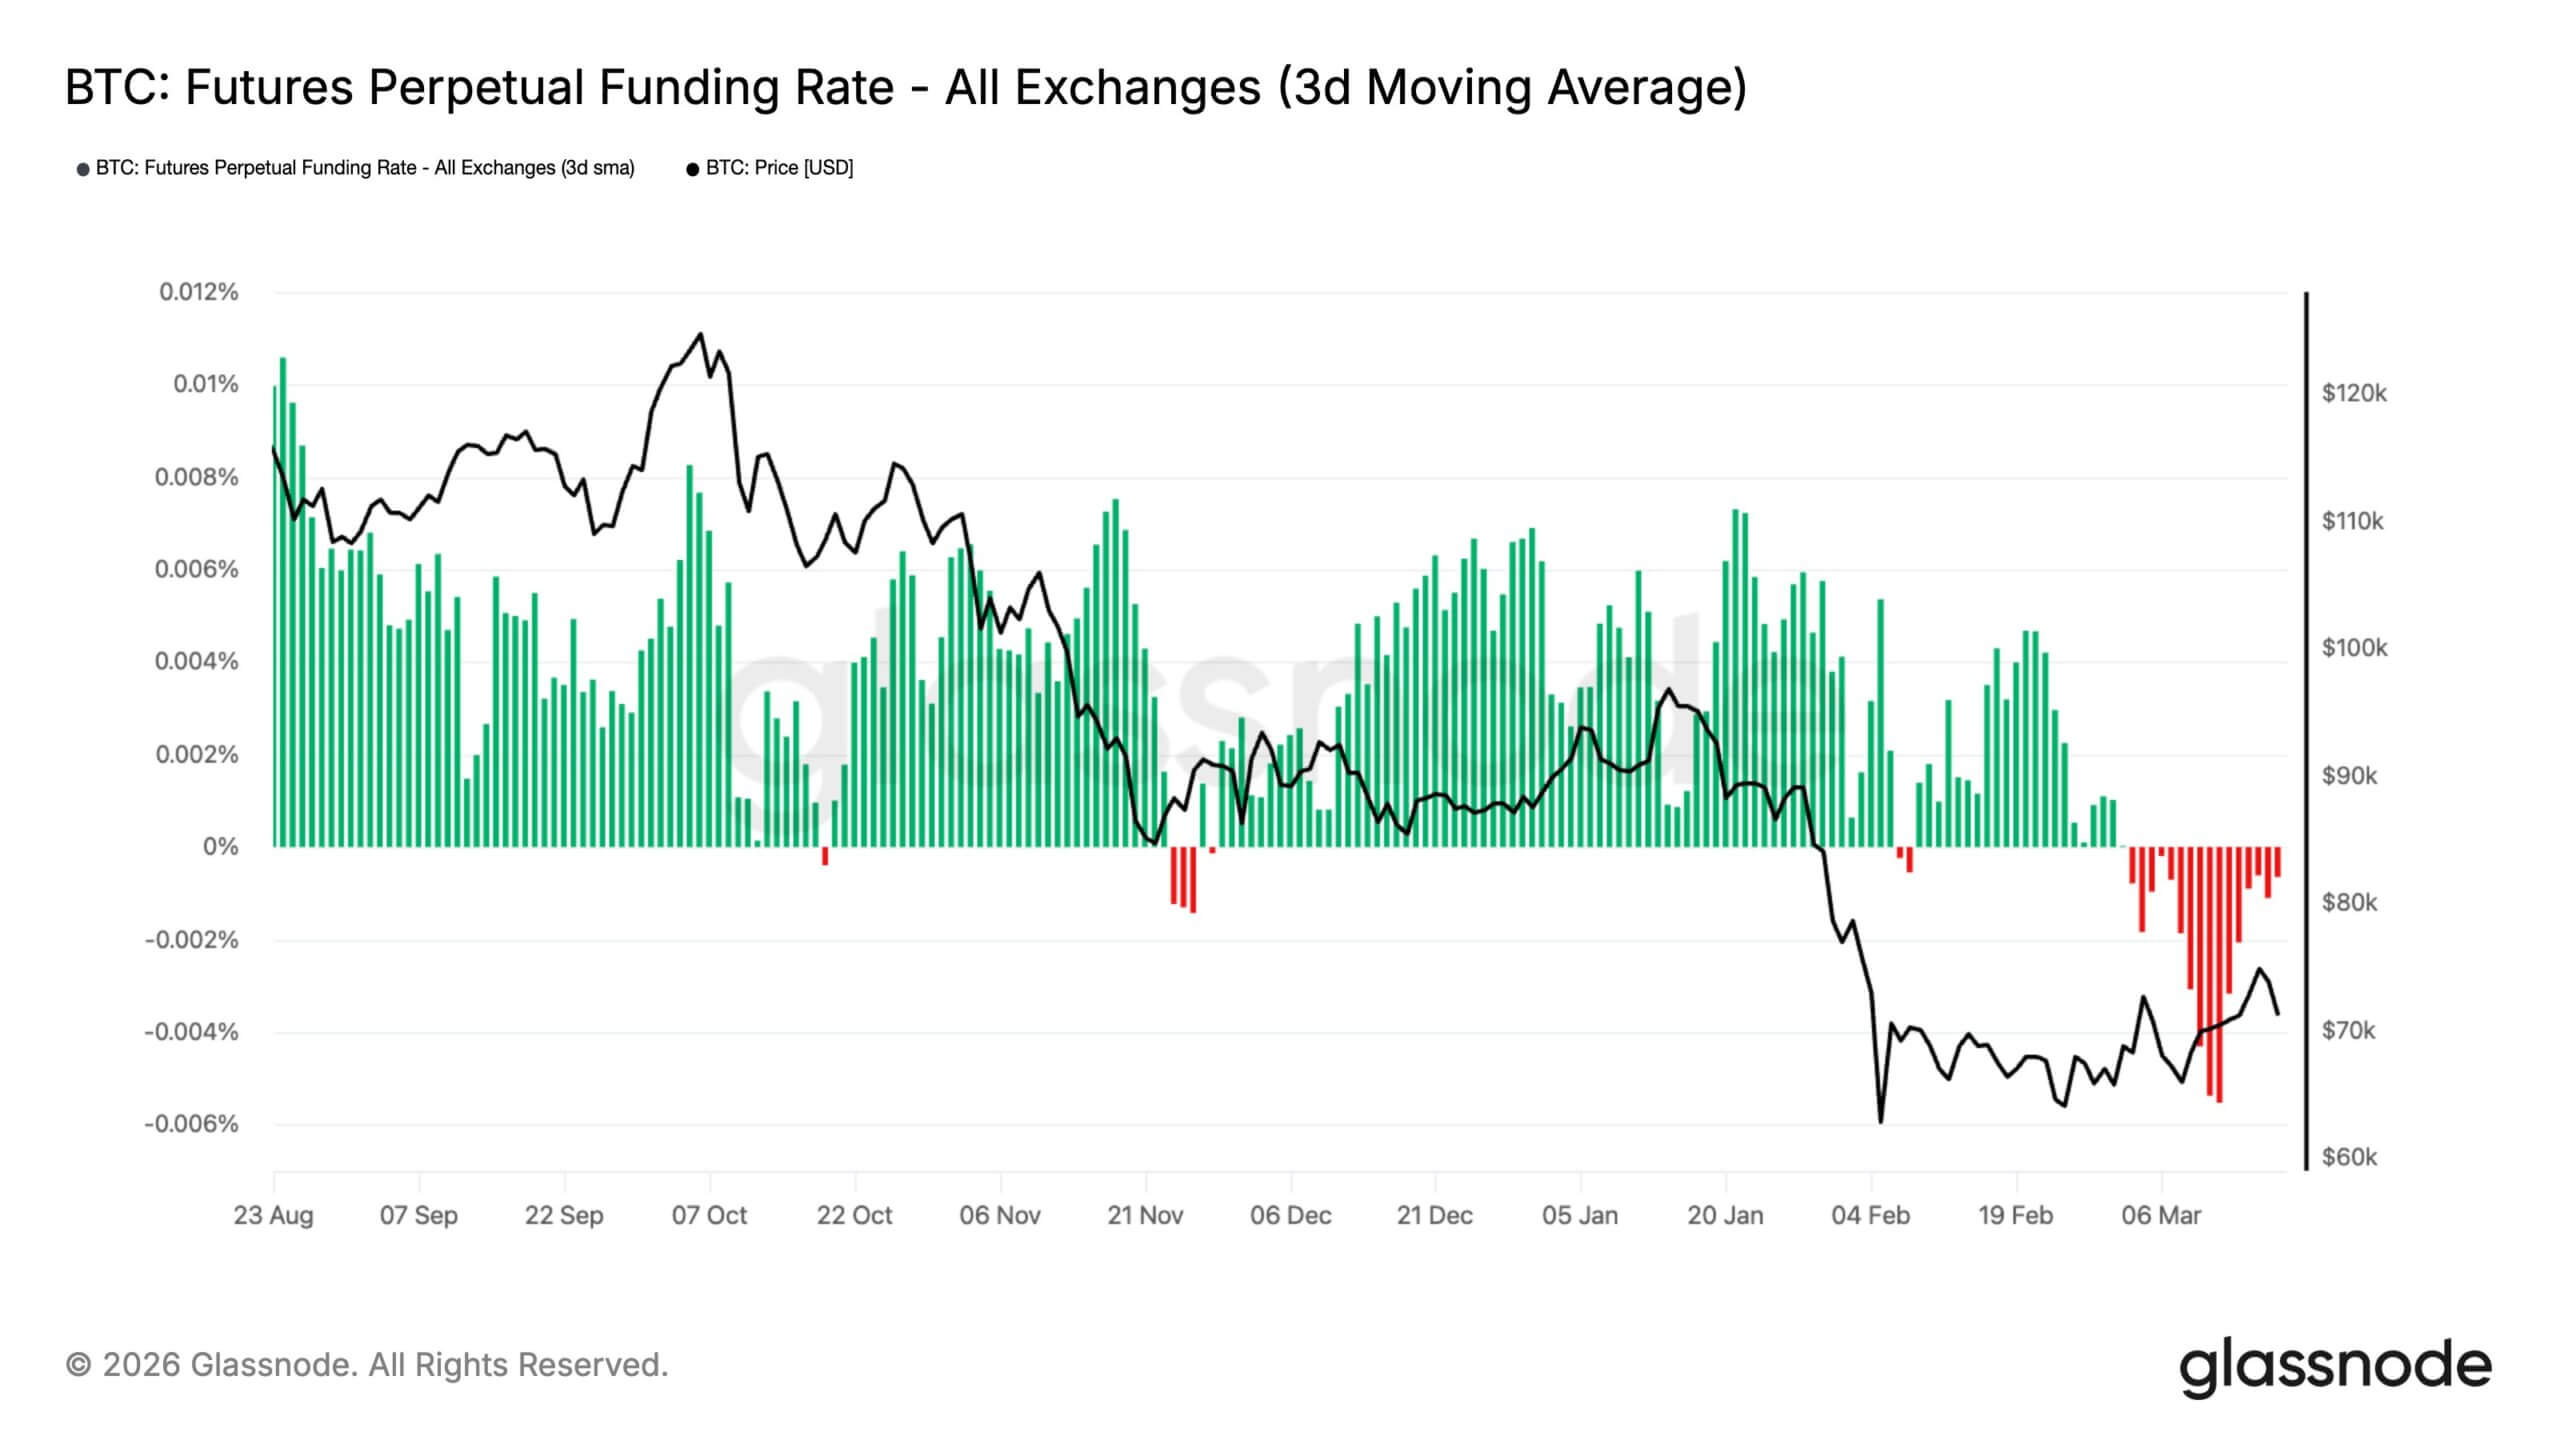 Bitcoin Perpetual Funding Rates (Source: Glassnode)
This means that traders were still leaning short even after BTC's recovery from recent lows.
What comes next for Bitcoin
The upside case is that this hedge-heavy positioning becomes fuel for a squeeze. Glassnode said the combination of crowded shorts, negative funding, and easing options stress leaves Bitcoin vulnerable to further squeeze-driven upside if spot demand continues to recover.
In that setup, the same defensive posture that now reflects caution could turn into forced buying if traders have to cover shorts into strength.
Meanwhile, CryptoQuant’s more constructive scenario points the same way.
The crypto analytics firm said daily demand from accumulator addresses remained high at 224,700 BTC, above the monthly average, while exchange outflows reached 11,300 BTC in three days. At the same time, the Coinbase Premium remained positive, suggesting US buyers were still active.
Under that view, institutions are absorbing liquidity while retail sells into war headlines, creating the conditions for a bear trap rather than a breakdown.
However, the downside case remains tied to a wider conflict and a more persistent inflation shock. CryptoQuant said that if the US sends more troops to Iran and the conflict escalates further, restrictive Fed policy could remain in place for longer.
In that scenario, BTC's probability of a revisit to the February bottom near $60,000 rises, with the final liquidation zone around $54,800.
For traders trying to time the next entry, the more useful signal may be less about headlines and more about positioning.
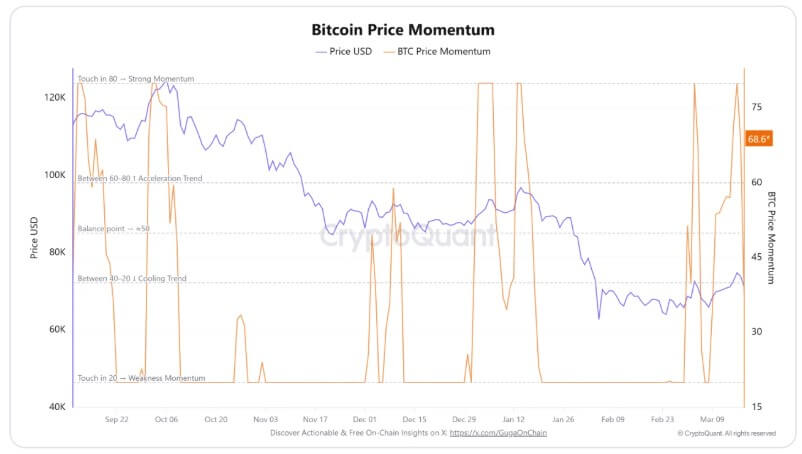 Bitcoin Price Momentum (Source: CryptoQuant)
CryptoQuant’s framework argues that price could continue to fluctuate between $69,000 and $65,000 amid heavy military tension, with a clearer entry only once the Bitcoin Price Momentum indicator returns toward its balance point near 50 and begins to show a reversal in the support region.