Bitcoin spent the weekend mostly within a familiar price channel, then slipped lower before recovering as traders reacted to the developing impact of the Iran war.
However, while real-world macro events now dictate Bitcoin's movements more than fundamentals or adoption levels, where on the chart it stops to test the waters has not changed.
Bitcoin has tested both long-term support and resistance since Friday. But with trading desks now back at their terminals, it has now rebounded into the middle of a price channel we've seen many times before.
This type of activity is exactly why I’ve kept coming back to the same price-channel framework since spot Bitcoin ETFs launched in early 2024.
My channels have consistently helped identify the zones where BTC is most likely to stall, bounce, or break into a new range, giving a clearer read on market structure than raw price action alone.
 Bitcoin original TradingView price chart showing Akiba's support and resistance channels mapped across historical price action, highlighting potential breakout, breakdown, and bounce levels.
Introducing The Akiba Price Channel Indicator
Over the weekend, I built a tool around that framework. Instead of relying solely on chart screenshots, it tracks how Bitcoin interacts with those channels in real time, flagging key bounces and breaks, making the analysis faster, cleaner, and easier to review.
 Akiba's new Bitcoin tool showing decline followed by sideways consolidation, with annotated support and resistance levels highlighting potential breakout, breakdown, and bounce scenarios since Jan 2026.
The dataset is built from horizontal price channels that I've tracked for over 2 years. The levels are manual, not machine-generated. They combine psychological round numbers, historical reaction zones, order-book depth, and leveraged futures accumulation. The interaction labels are also narrow by design.
- A “break up” means BTC moved through a boundary without first rejecting it.
- A “break down” means the same in the other direction.
- A “bounce” means the price rejected the line and stayed inside, or returned to, the channel structure.
With this framework, I'm not trying to call direction. The tools show where the market has actually reacted, and when it's likely to do so again.
That record still leans hard toward rejection over escape. Across the full sample, BTC logged 234 interactions, 178 bounces, 30 break downs, and 26 break ups. That puts the bounce share at 76.1%.
The data since March 3 tells a similar story. It shows 54 interactions, with 41 bounces, seven break downs, and six break ups.
The recency heuristic (which is not a predictive model) puts the next interaction at 72.4% for a bounce, 16.4% for a break down, and 11.2% for a break up.
The indicator says support returned, with resistance still overhead
Bitcoin moved back above the $67,995 boundary today after a failed break below $66,894 on Sunday.
The move put BTC back inside the $68,000-$71,500 range after a short trip into the lower $67,900-$61,700 channel. As of press time, Bitcoin is holding $69,000.
") Akiba’s Bitcoin price channel tool showing BTC price action with interaction signals highlighting break up, break down, and bounce levels on the chart since March 3.
Akiba’s Bitcoin price channel tool showing BTC price action with interaction signals highlighting break up, break down, and bounce levels on the chart since March 3.The clearest read is that BTC has repaired back into an active range, but it has not yet proved a new expansion leg.
The first fact in that view is simple, the March 8 move below $66,900 did not hold. The second is just as important, price has reclaimed $68,000, but it still sits below $71,500, the ceiling of the current channel. In other words, support returned before a breakout arrived.
That leaves Bitcoin heading into another week of macro releases and cross-market pressure with a working floor, but without a clear upside escape.
The strongest working level in the recent sample is $68,000. It drew 25 interactions, more than any other visible boundary. Twenty of those were bounces. Three were break downs. Two were break ups.
 Bitcoin price chart from March 3 to present showing BTC rejecting near $74,000 resistance and bouncing from support around $67,000 with interaction signals.
That does not make it permanent support, but it does make it the level that has done the most work.
The latest sequence reinforces that role. BTC first treated $68,000 as resistance after reclaiming $66,894, then moved through it, then bounced from above it. That is the clearest sign in the dataset that the market has rebuilt a floor after last week’s weakness.
The second line to watch is $66,894. That level is the top of the lower $66,900-$61,700 channel, so it acts as the failure line under the current repair. It saw 12 visible interactions, eight of them bounces.
The March 8 break down through that line was key, followed by a March 9 break up that reversed it.
When a downside move loses acceptance that quickly, the market usually treats it as a failed test rather than the start of a durable lower range. That is what the chart shows here. BTC did not stay below $66,900 long enough to build a new base there.
The main ceiling is $71,500. That level posted six visible interactions, five of them bounces and only one clean break up.
Above it sits $72,000, then the $73,500-$73,800 area, which also showed repeated rejection in the recent sample.
So the upside path is clear, but it is layered. BTC has moved from weakness back into a channel that still has a well-defined lid.
| $68,000 | 25 | 20 bounces, 3 break downs, 2 break ups | First support and main pivot inside the active range |
| $66,900 | 12 | 8 bounces, 2 break downs, 2 break ups | Failure line, the latest downside move below it did not hold |
| $71,500 | 6 | 5 bounces, 0 break downs, 1 break up | Nearest ceiling, bulls still need acceptance above it |
| $72,000 | 4 | 2 bounces, 1 break down, 1 break up | Next trigger if $71,500 gives way |
| $73,500-$73,800 | 7 combined | 6 bounces, 1 break down, 0 break ups | Upper supply zone from last week’s failed push |
That structure also helps separate accepted moves from fragile ones. The March 7 break down through $68,000 was accepted for a time because BTC then spent roughly two days trading beneath that line and pressing into the $66,900 area.
By contrast, the March 8 break below $66,900 looks fragile because it reversed within hours. The March 9 move back above $68,000 now counts as an accepted reclaim, but only in an early sense. One bounce from above is a good start.
Full upside acceptance still requires a move through $71,500.
The broad message from the channel work is restrained. BTC has re-entered a range that has produced more rejections than escapes.
That makes $68,000 the first line that bulls need to defend and $71,500 the first line they still need to take.
Until price changes one of those facts in a durable way, the range remains the best description of the market.
Macro still points to a range, with event risk at the edges
The channel picture would look cleaner in a soft, risk-on macro backdrop. That is not the environment Bitcoin is trading in.
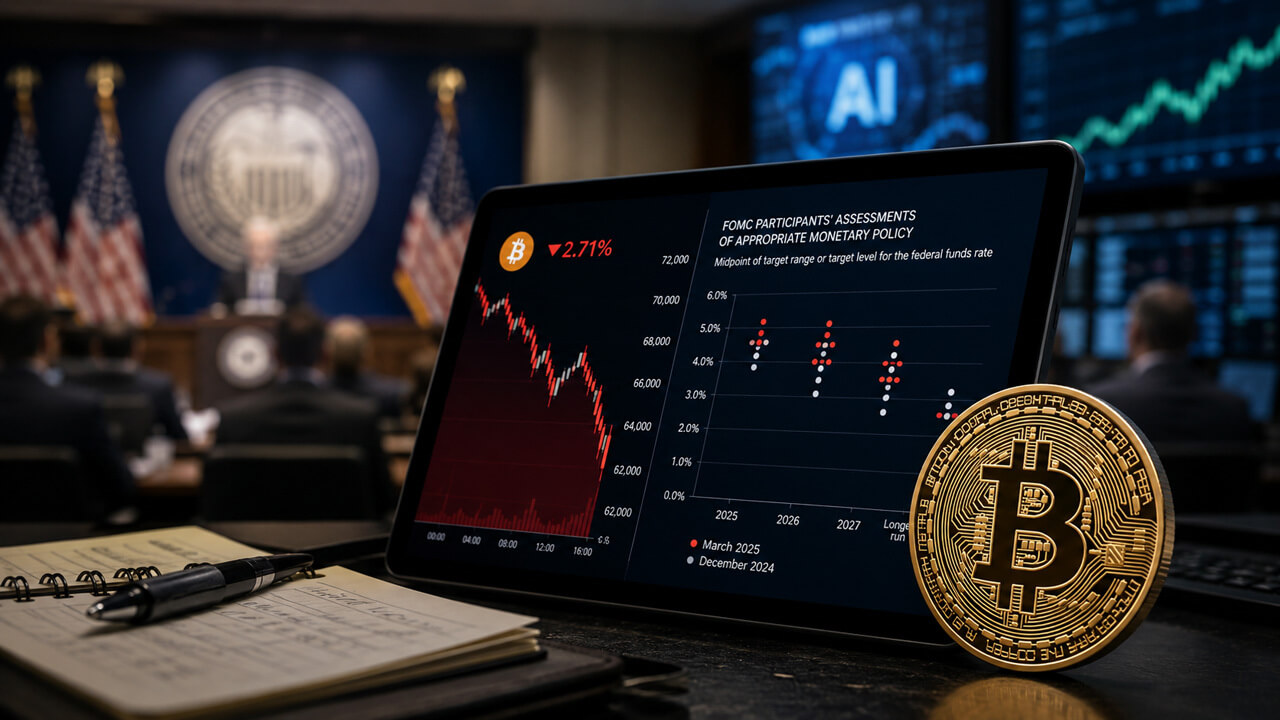
The Federal Reserve held its policy rate at 3.5%-3.75% in its January statement and said inflation remained somewhat elevated. January CPI was 2.4% year over year, while core PCE was still 3.0% year over year in December.
Labor data points the other way. February payrolls fell by 92,000, unemployment rose to 4.4%, and average hourly earnings were up 3.8% from a year earlier. That combination tends to keep markets guessing. Growth is cooling, but inflation is not fully gone.
Rates and commodities have added another layer. The US 10-year yield rose from 3.97% on Feb. 27 to 4.13% on March 5.
In a separate shock, Brent crude briefly rose to $119.50 before settling a little above $101 amid the Iran conflict. That does not determine Bitcoin’s path on its own. But it does show why markets have not shifted into a clean chase for risk.
Higher yields can limit how far risk assets rerate. Higher oil prices can keep inflation fears alive just as labor data softens. The result is a market that can bounce hard from washed-out levels without getting a free pass to trend.
How the broader crypto market is reacting
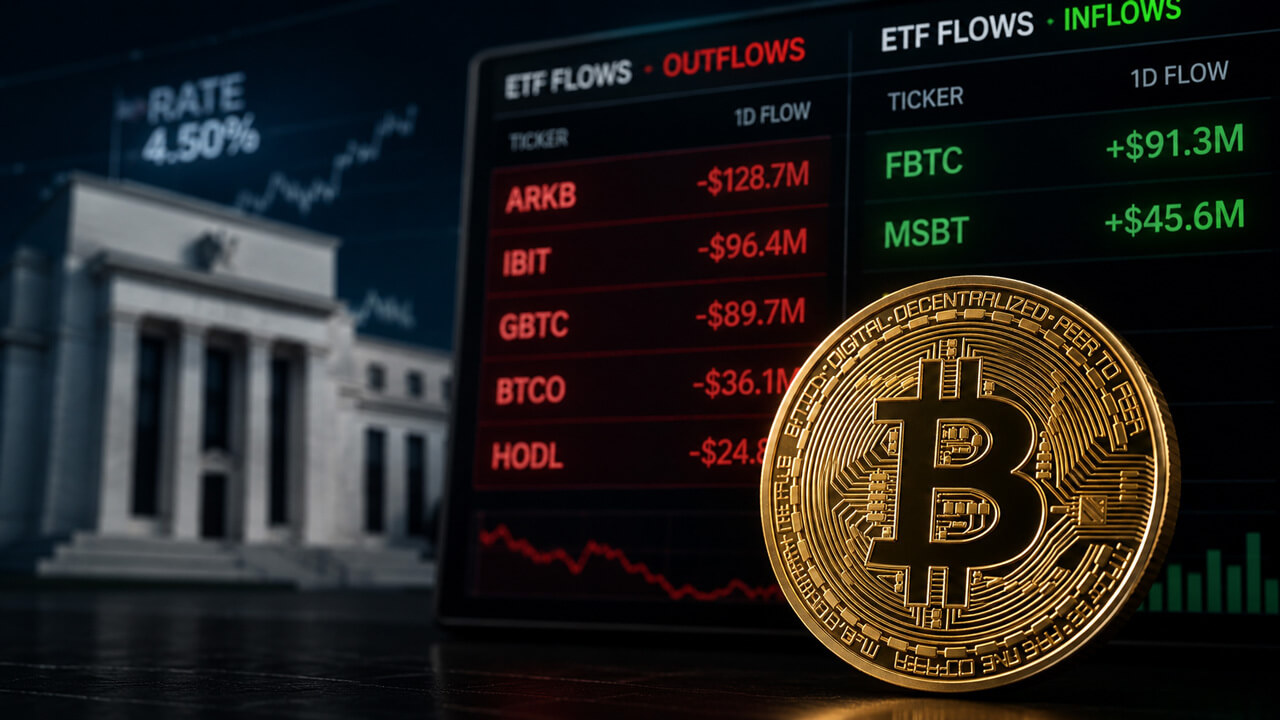
Crypto-specific positioning has improved enough to support the repair, but not enough to settle the argument. Digital-asset products took in $1 billion in the week of March 2, including $881 million into Bitcoin.
That ended a five-week run of outflows. But the same source said the earlier washout was large, five straight weeks of spot BTC and ETH ETF outflows totaled $4.3 billion. It also said futures open interest fell to about $7.6 billion and leverage dropped to 25% from 33% in October.
That is the kind of reset that can help a market build a floor. It still falls short of proof that fast money is ready to chase the next leg higher.
Options traders still look cautious. Bloomberg said traders continued to favor downside protection even after the recent rebound. That lines up with the channel data better than a breakout call does. The market has rejected lower acceptance below $66,900.
It has not yet embraced higher acceptance above $71,500. In a mixed macro setting, that is often how transitions look, support rebuilds first, conviction comes later, and sometimes it never comes at all.
A late-February update from CoinShares argued that Bitcoin was still in consolidation with a modest downside bias, even as several conditions for a bottom were starting to form. That fits the present setup. The data do not show a market that has broken free of macro drag.
They show one that has flushed leverage, found buyers back inside a known range, and is waiting for the next piece of evidence.
That is also why the latest bounce should be read as a repair inside uncertainty, rather than a settled verdict on the quarter.
Lower yields, calmer energy prices, or softer inflation prints could help BTC press the top of the range. Sticky inflation, firm yields, or another commodity shock could do the opposite.
The channel maps how price is responding to those drivers.
What the next move looks like from here
The least stretched narrative is that Bitcoin is stabilizing inside a reclaimed channel, rather than starting a confirmed trend. The numbers support that. The full sample is still bounce-dominant at 76.1%. The recent sample is bounce-dominant at 75.9%.
The recency heuristic still tilts toward another rejection rather than a clean directional break. And the most recent directional event that stands out is the failure of downside acceptance below $66,900.
That leaves three live paths and one tail risk. The weights below are an analytical overlay on the channel record, not market-implied odds.
| Base | 50% | BTC holds $68,000 and spends time inside the current channel without full upside acceptance | $68,000 to $71,500, with possible probes toward $72,000 |
| Bull | 25% | BTC keeps support at $68,000, accepts above $71,500, and then clears $72,000 | $72,000, then $73,500 to $73,800, with $77,000 above |
| Bear | 20% | BTC loses $68,000 again and this time builds acceptance below $66,900 | $66,900, then $61,700 and $61,000 |
| Tail risk | 5% | Macro stress forces a deeper liquidation and lower-channel acceptance | $61,700, $61,000, then $56,650 |
The base case remains the cleanest because it asks the market to do what it has done most often in this sample, respect a boundary, move inside the range, and force traders to prove the next break instead of assuming it.
The bull case is simple too, but it needs evidence. BTC would need to hold above $68,000 through the next round of macro data and then turn $71,500 from ceiling into floor. Only then does $72,000 become more than a wick target.
Above that, the failed supply zone around $73,500-$73,750 comes back into view, with $77,000 as the next upper channel boundary on the broader map.
The bear case is not dead just because the March 8 breakdown failed. It only lost the first test. If BTC falls back through $68,000 and then starts spending time below $66,900, the structure changes fast.
The lower $66,900-$61,700 channel would open again, and the conversation would shift from repair to renewed weakness.
A March 5 report cited a Standard Chartered view that still allowed for a near-term slide toward $50,000 before recovery and carried a $100,000 year-end 2026 target. The wide gap between those figures is useful because it shows how uncertain the path remains even when long-run forecasts stay high.
A more constructive case is easier to state than to prove. The market has already done the first part by rejecting a fresh stay below $67,900 and then taking back $68,000. The second part is harder. Bulls need repeated acceptance above $71,500 and then above $72,000, where last week’s move began to stall.
If that happens while flows keep improving and options hedging eases, the upper channel cluster near $73,500-$73,750 becomes a live retest rather than a memory of the last failed push.
For now, the channel offers a disciplined way to read that uncertainty.
BTC has taken back $68,000. It has rejected a fresh stay below $66,900. But it has not yet forced a change in the most important nearby fact, $71,500 still caps the current range. The next evidence is straightforward.
If Bitcoin keeps holding the lower edge and starts closing through the upper one, the upper channels return to the foreground.
If it loses both support lines again, the market will start looking back toward $61,726.
Until one of those things happens, the strongest conclusion is the narrow one, the range is alive, the lower breakdown failed, and the next test is still overhead.
If you'd like access to Akiba's Price Channel Indicator, send me a DM on Twitter
Disclaimer: This article is for informational and analytical purposes only and does not constitute financial or investment advice. Market scenarios and probabilities discussed are observational interpretations of price data, not predictions. Readers should conduct their own research and consult a qualified financial advisor before making investment decisions.