
Bitcoin is back at a crossroads it has navigated multiple times in prior cycles, and this may be where the real test begins in this cycle.
After weeks of trying to turn the low-$80,000s into a new recovery zone, BTC has returned to the $66,900-$68,000 area, the same band I have used through several recent CryptoSlate pieces as the difference between repair and renewed downside.
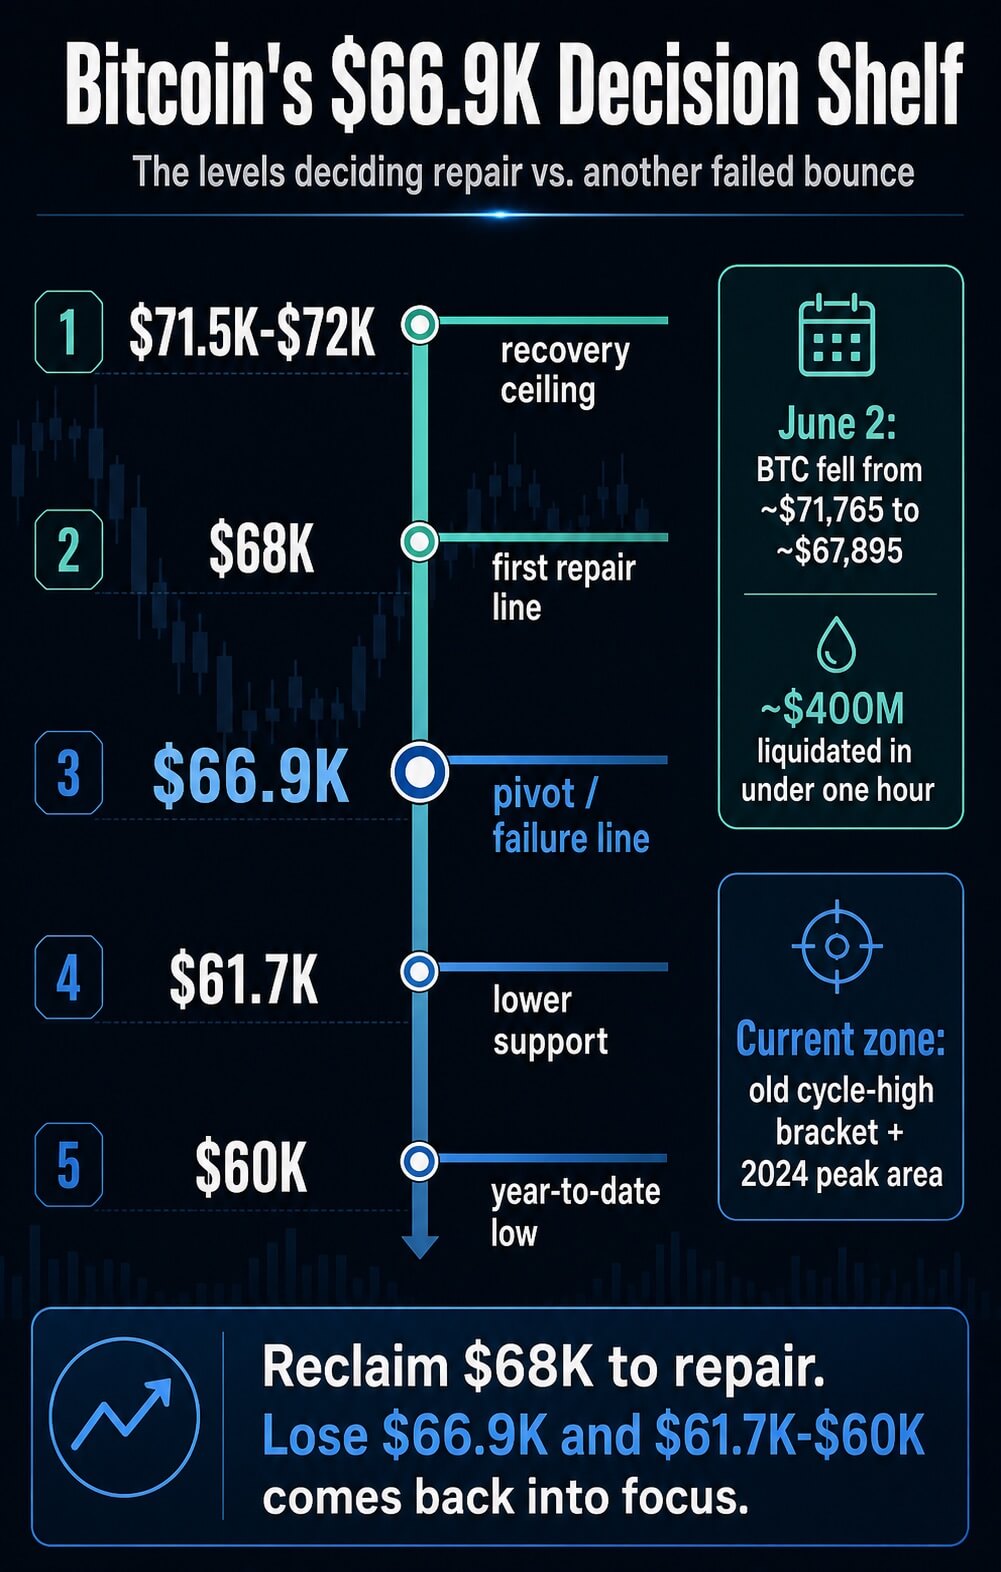
A June 2 break below $68,000 sent Bitcoin from roughly $71,765 to $67,895 and triggered about $400 million in liquidations in under an hour.
By Wednesday morning in London, CryptoSlate's Bitcoin price page showed BTC near $66,942, putting spot price directly inside the shelf.
The price point overlaps with Bitcoin's old cycle highs, the 2024 peak zone, and the failure line from the earlier channel work.
We must now ask ourselves: did Bitcoin revisit a known support shelf before rebounding, or has the market confirmed that the prior bounce failed?
The old map is back in control
My level map always depended on acceptance across sessions over one candle.
In March, my CryptoSlate analysis treated the $68,000-$71,500 area as the range Bitcoin needed to hold and identified $66,900 as the failure line below it.
The idea was that BTC had avoided a larger drop only if it could keep trading above the lower edge and rebuild toward the top of the range.
That same framework came back after the late-March drop toward $65,000. At the time, the recovery case needed Bitcoin to reclaim $68,000 first, then prove it could work back toward the $71,500-$72,000 ceiling.
If it failed there, $66,900 stayed active as the line that kept the downside path open.
That is where the market is again. The June 2 liquidation move dragged price back into the bracket that has separated recoveries from failed bounces throughout the recent channel work.
In practical terms, $68,000 has become the first line Bitcoin has to reclaim to show that the flush was a support test, not the start of another leg lower.
The upper side of the map is just as important. I have repeatedly treated $71,500 as the area where recovery attempts had to prove themselves.
My March 5 analysis warned that repeated rejection there raised the risk of rotation down through $68,000 and $66,900 toward the low-$60,000s.
That sequence gives the current market a cleaner signal. A wick into the band can be noise; a failure to reclaim the band changes behavior.
For bulls, the job is to turn $68,000 back into traded acceptance. For bears, the confirmation is sustained weakness through $66,900.
Until one side gets that, the market remains in the middle of an unresolved argument.
What actually panned out
The useful part of revisiting these levels is the sequence of decision points, more than perfect tick-by-tick precision.
On that test, the roadmap held up better than it may have felt in real time. Bitcoin held around $70,000 in early March, delaying the $49,000 path as the market tested the upper range again.
The follow-up asked whether the downside call had been invalidated. The market then failed to cleanly clear the upper side of the range.
The repeated inability to turn $71,500-$72,000 into support kept the old risk path alive.
The next phase looked better for bulls. In early May, Bitcoin was back in the low-$80,000s, with the market asking whether a new 2026 high was coming.
That was the V-shaped move from the late-March lows: roughly $65,000 at the end of March, back toward the low-$80,000s by early May.
Even that upside framework kept the $65,000-$70,000 area as the first support zone if risk appetite faded.
The move back to this band follows the first major support region that was supposed to come into play if the low-$80,000s could not hold.
The current price action has therefore answered part of the earlier question. The market delayed the deep-bear case, but it also failed to establish enough acceptance above $71,500-$72,000 to retire it.
The rally stretched higher, lost altitude, and returned to the same shelf that was marked as the next test if momentum broke.
That is the point of looking backward here. The prior framework only had to tell readers which levels would decide whether strength was real.
So far, Bitcoin has respected the order of the map: first the ceiling near $71,500-$72,000, then the repair line at $68,000, and now the $66,900 edge.

Macro did not give Bitcoin much cover
The chart levels gained force as the macro backdrop stopped helping.
In mid-May, I linked Bitcoin's retreat from the low-$80,000s to Treasury yields, ETF-flow dependence, oil, the dollar, and broader risk appetite.
The June breakdown is happening during a jobs-data week, with traders watching labor-market data, Fed expectations, and long-end yields alongside crypto-native positioning.
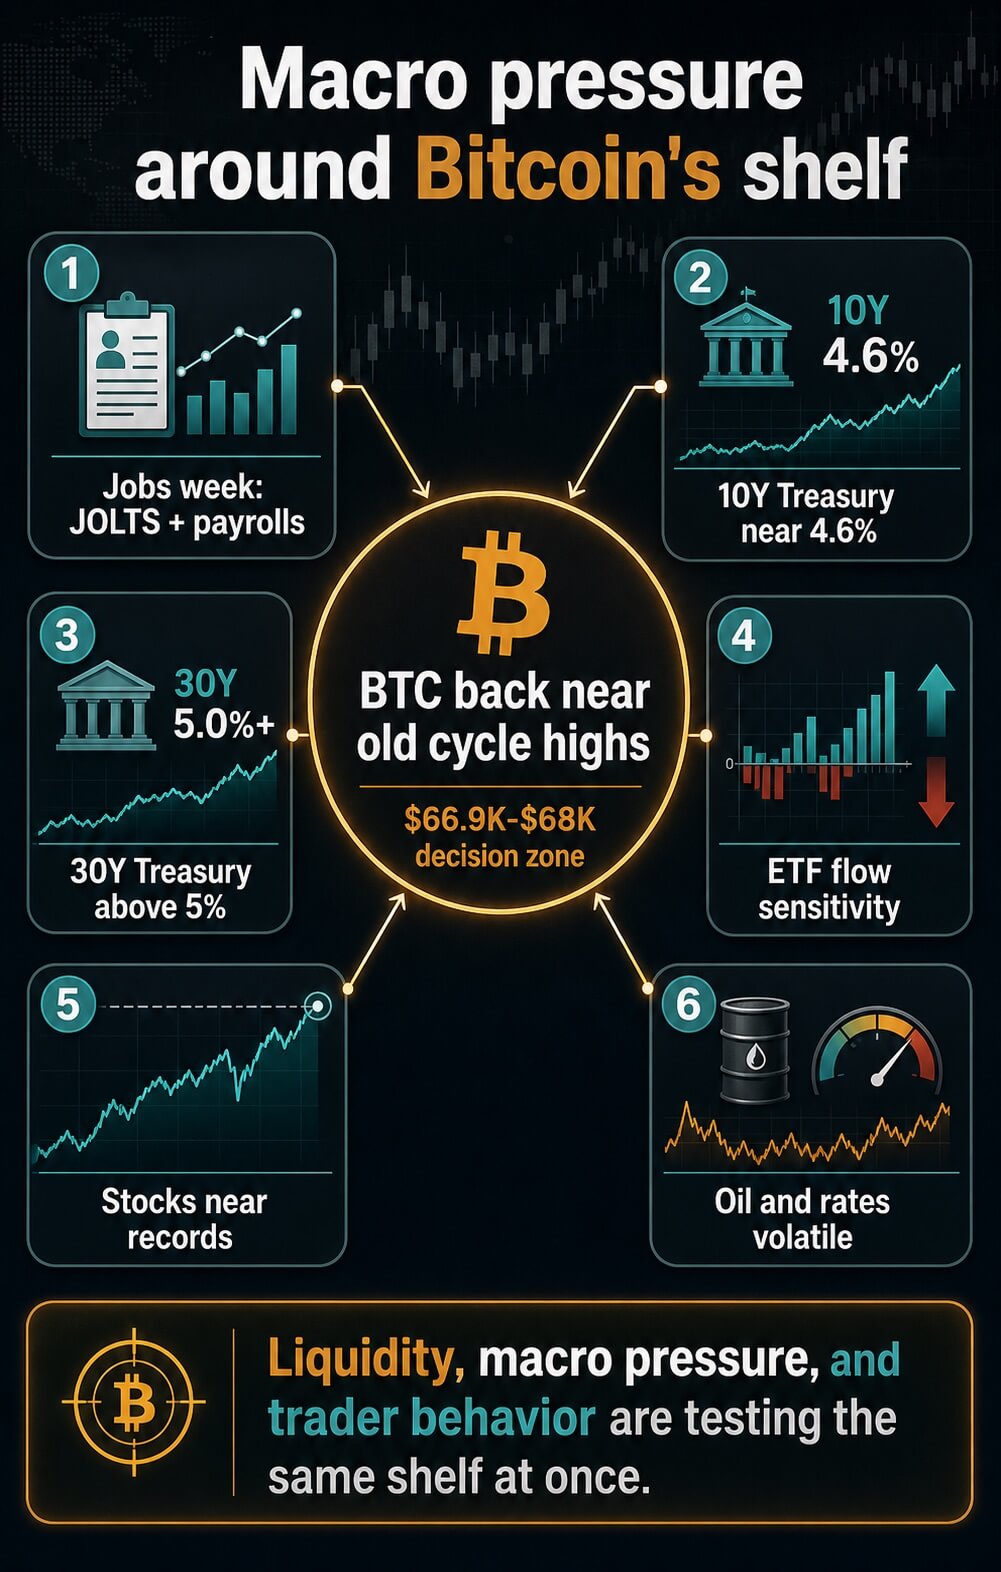
CryptoSlate's June jobs-week setup noted that Bitcoin was facing JOLTS and payrolls with the 10-year Treasury yield near 4.6%, the 30-year above 5%, ETF outflow pressure, and a market still pricing a Fed hold.
That gives the current level a macro catalyst. It is a support zone being tested as the bond market continues to pressure long-duration risk assets.
The tension is sharper because equities have held up better. US stocks are near record highs even as oil-driven volatility and rate pressure remained in the background.
Bitcoin, by contrast, has given back the early-May rally and moved back toward the same old all-time-high bracket that once defined the upper end of prior cycles.
That divergence changes the tone of the level test. If stocks are still near records while Bitcoin is losing the low-$80,000s and revisiting old-cycle highs, the weakness points to more than a broad risk-off washout.
It points back to crypto-specific pressure, ETF flow sensitivity, and the failure to build acceptance above the recovery ceiling.
Bitcoin is weakening into a known technical shelf without an obvious macro relief valve.
If yields keep pushing higher or ETF flows fail to absorb the selling, the chart levels become harder to defend. The same price shelf is being tested by liquidity, macro pressure, and trader behavior at once.
The next test is acceptance over one wick
This is why $66,900 and $68,000 carry more weight than the exact low from a single overnight move.
If Bitcoin can defend the $66,900 area and reclaim $68,000, the first repair target is acceptance back inside the prior range, followed by another attempt to rebuild toward $71,500-$72,000.
That would leave the liquidation shock on the chart, but it would show that the market treated the move as a flush into support rather than a confirmed breakdown.
If Bitcoin loses that defense, the lower path becomes the cleaner signal. A March CryptoSlate overlap piece directly connected $66,900 resistance or failure to a possible move toward $61,700, and the broader roadmap keeps the yearly low near $60,000 in focus, with that level beneath.
From the current $67,000 area, that is close enough to keep in view while still requiring BTC to lose the shelf first.
That's why I tend to work with roadmaps rather than predictions.
$71,500-$72,000 was the zone that would have shown recovery strength. $68,000 was the first repair line. $66,900 was the lower edge. $61,700-$60,000 was the next area if the edge failed.
Bitcoin is now sitting on that edge again.
The market can answer without drama. A sustained reclaim of $68,000 would put the range-repair case back on the table.
Failure to hold $66,900 would bring the return to $61,700 and the yearly low near $60,000 into question. Until one of those happens, the most honest conclusion is that Bitcoin has returned to the exact bracket that was supposed to decide whether the prior bounce was real.