Bitcoin is pushing up against a patch of resistance right as the bigger economic picture gets trickier. The price is pushing toward $75,000, with some important on-chain sellers stepping in and two big US data releases on deck. These will determine whether Bitcoin can break through $ 78,1 and get knocked back again.
According to an Apr. 15 report by Glassnode, the current setup is at a measurable level of tension. Short-Term Holder Supply in Profit sits at 43.2%, still below the roughly 54.2% level where bear market rallies have historically exhausted, leaving room to climb.
However, the 30-day EMA of the Realized Profit/Loss Ratio has reached 1.16, indicating that investors are selling on strength more than buying dips. BTC touched an intraday high of $75,218, leaving 5.2% of the distance to the ceiling.
Glassnode describes the current move as a relief rally inside an ongoing bear market structure and says any sustained break above $78,100 requires fresh demand capable of absorbing the overhead supply investors have been unloading into the bounce.
That demand catalyst has yet to materialize, which is why the macro calendar arriving in the next two weeks carries more weight than usual.
The levels that decide the move
Glassnode organizes the price map around three zones.
The first real test sits between $74,000 and $76,000, where short-liquidation clusters stack and where recent rallies have repeatedly stalled. Bitcoin is already trading inside this first decision zone.
The main ceiling is $78,100, which Glassnode defines as the True Market Mean, the average acquisition cost of actively transacted coins, excluding lost or dormant supply.
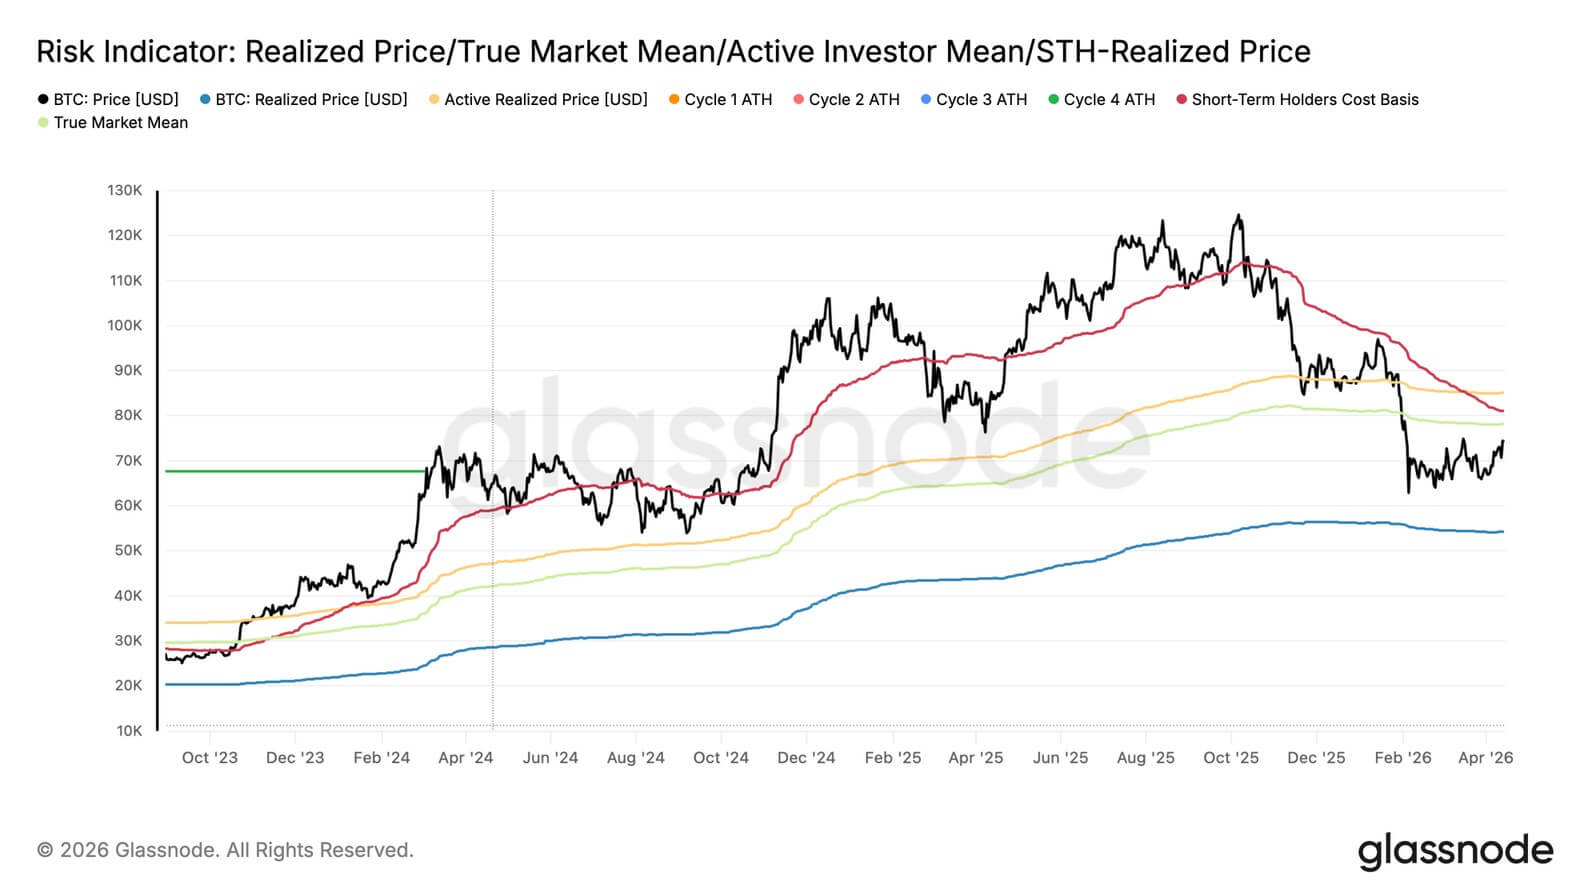 Bitcoin spot price trades below the True Market Mean and Short-Term Holder Cost Basis in April 2026, placing it within Glassnode's bear-market value zone. Source: Glassnode
Trading below this level places Bitcoin in what the report called the bear market value zone, historically consistent with a market still working through its transition toward recovery.
A reclaim and hold above $78,100 would alter the rally's tone, while another rejection there would keep the bear structure intact.
On the downside, Glassnode places the densest liquidation cluster between $63,000 and $65,000, where long liquidation exposure is highest, and the market has repeatedly absorbed price probes.
A failed break in the $74,000-$76,000 zone would first reopen conversation around the upper $60,000s as a structural reference point, but $63,000-$65,000 is the more directly sourced support zone in the report.
The macro backdrop is no longer easy
March's official data package reinforces the Fed's case for holding.
CPI rose 3.3% year over year, with core CPI at 2.6% and the energy index up 10.9% on the month. PPI rose 0.5% month over month and 4.0% year over year, and payrolls added 178,000 jobs, with unemployment held at 4.3%.
The Fed's March statement made explicit its posture that uncertainty about the economic outlook has stayed elevated and that the implications of geopolitical events in the Middle East for the US economy are unclear.
In April, overall activity expanded at a slight-to-modest pace. Still, the Middle East conflict was a major source of uncertainty, complicating hiring, pricing, and capital investment decisions, with many firms adopting a wait-and-see posture.
Energy and fuel costs climbed sharply across all Districts, and input-cost broadening extended beyond energy.
That combination of sticky core inflation, elevated geopolitical uncertainty, and firms pulling back on investment removes the easy macro tailwind Bitcoin would need to push through the $74,000-$76,000 cluster and hold above $78,100 on conviction.
The macro backdrop raises the bar for a Bitcoin breakout. Firm inflation data, a cautious Fed, and higher energy costs all tighten the conditions required for a conviction-led move higher.
The IMF's April 2026 World Economic Outlook adds the global frame.
Under a limited-conflict assumption, global growth slows to 3.1% in 2026 and 3.2% in 2027, while global inflation ticks higher.
The IMF's Global Financial Stability Report notes that since late February, stock prices have declined while bond yields have climbed, as rising energy costs and expectations of higher interest rates have tightened overall financial conditions.
Bitcoin's path through on-chain resistance runs more smoothly in an easing environment than in one where risk assets are already fighting tighter macro pricing.
| CPI (YoY) | 3.3% | Keeps inflation pressure alive |
| Core CPI (YoY) | 2.6% | Limits easy dovish repricing |
| Energy index (MoM) | +10.9% | Reinforces inflation and geopolitical risk |
| PPI (MoM) | +0.5% | Signals pipeline price pressure |
| PPI (YoY) | 4.0% | Keeps inflation backdrop firm |
| Payrolls | +178,000 | Labor market still holding up |
| Unemployment | 4.3% | Supports Fed caution rather than urgency to ease |
| IMF global growth 2026 | 3.1% | Slower global growth backdrop |
| IMF global growth 2027 | 3.2% | Recovery still restrained |
| Financial conditions | Tighter since late February | Harder backdrop for risk assets |
What the derivative readings add
Spot cumulative volume delta (CVD) has improved, but Binance-led buying is outpacing Coinbase, pointing to stronger offshore and retail participation than institutional follow-through.
CME open interest and US ETF AUM have begun to rebuild, but both remain below prior highs, consistent with cautious re-engagement.
Options show one-month implied volatility around 42.6%, the 25-delta skew tilted toward puts, and a one-week volatility risk premium near -2 vol points, with realized volatility above implied volatility. These points depict a structure that prices a defensive market in wait mode.
Glassnode also notes that a large pocket of negative gamma sits near the $75,000 strike, with market makers appearing structurally short calls at that level.
As spot approaches, hedging flows could intensify, potentially amplifying upside moves. Yet, that dynamic describes the mechanical feature of short-covering.
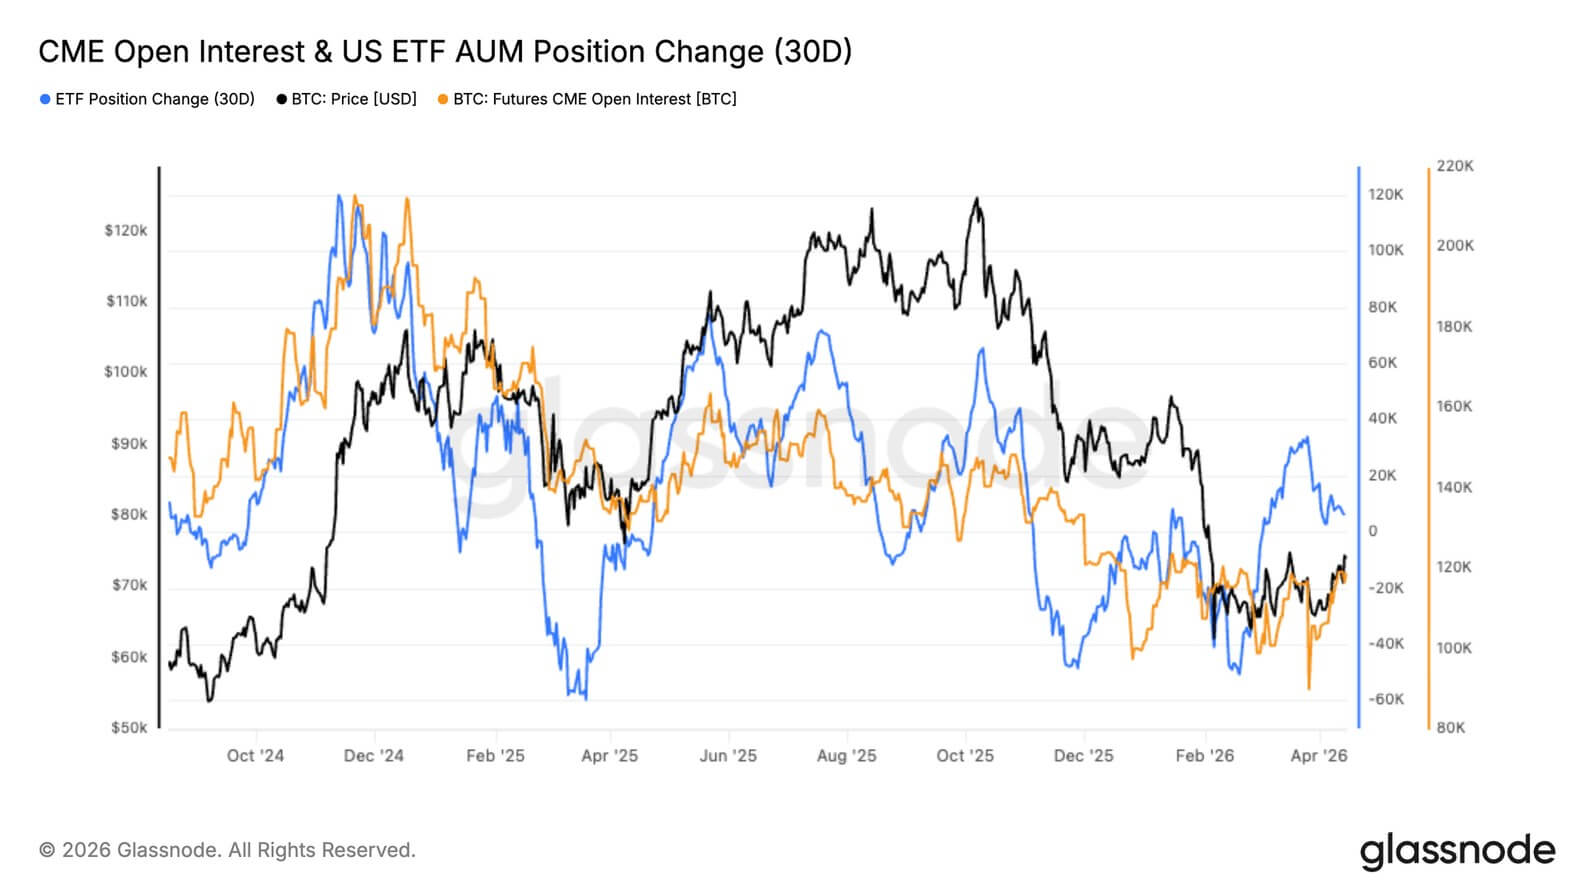 US ETF AUM and CME futures open interest both show negative 30-day position changes through early 2026, with a tentative recovery in April. Source: Glassnode
Two futures for this setup
Bitcoin is testing resistance just as the two most consequential near-term macro checkpoints arrive.
The Census Bureau's March Advance Monthly Retail report is due Apr. 21. The next FOMC decision lands Apr. 28-29. Retail sales will provide the clearest near-term read on whether consumer demand is holding up or softening amid rising energy costs and geopolitical uncertainty.
The FOMC will either confirm or complicate the Fed's current wait-and-see posture.
A softer retail number or a Fed read that eases yield expectations would give Bitcoin the macro cover to attempt a clean break of the $74,000-$76,000 cluster.
A hotter or more complicated read would feed the distribution activity already visible in the 1.16 realized profit/loss ratio.
The bull case requires the on-chain and macro levers to pull in the same direction. Bitcoin clears the $74,000-$76,000 short-liquidation cluster and builds enough spot demand, with ETFs broadening, CME participation accelerating, and Coinbase activity turning definitively positive to absorb the profit realization already underway.
A macro read from retail sales or the FOMC that eases rate expectations would supply the external catalyst that Glassnode's framework requires.
If those conditions converge, then $78,100 becomes a level the rally actively challenges, and a close above it would redefine the rally's character.
Glassnode says the probability of a spike toward, and potentially above, the True Market Mean stays considerable in the mid-term.
| Bull case | BTC clears $74K–$76K, spot demand broadens, ETFs/CME/coinbase participation improves | Softer retail sales or a Fed outcome that eases yield expectations | $78.1K gets challenged and potentially reclaimed |
| Bear case | BTC fails in $74K–$76K, profit-taking continues, rally stays a squeeze | Firm retail sales or a hawkish Fed read keeps financial conditions tight | Focus returns to upper $60Ks, then $63K–$65K |
| Key tell | Demand absorbs overhead supply | Macro gives risk assets breathing room | Rally changes character only above resistance |
The bear case runs through macro friction arriving before demand does. If retail sales come in firm or the FOMC delivers a more hawkish-than-expected read, risk assets face renewed selling.
Bitcoin fails again in the $74,000-$76,000 zone, the realized profit/loss ratio climbs, and the downside focus returns toward the upper $60,000s as a first reference point and $63,000-$65,000 as the deeper liquidation-backed support zone.
That outcome aligns with Glassnode's framing that the current structure is a bear-market bounce, and until Bitcoin reclaims the Short-Term Holder Cost Basis at $81,600, the medium-to-long-term bias remains tilted toward the downside.